1.nginx 日志收集
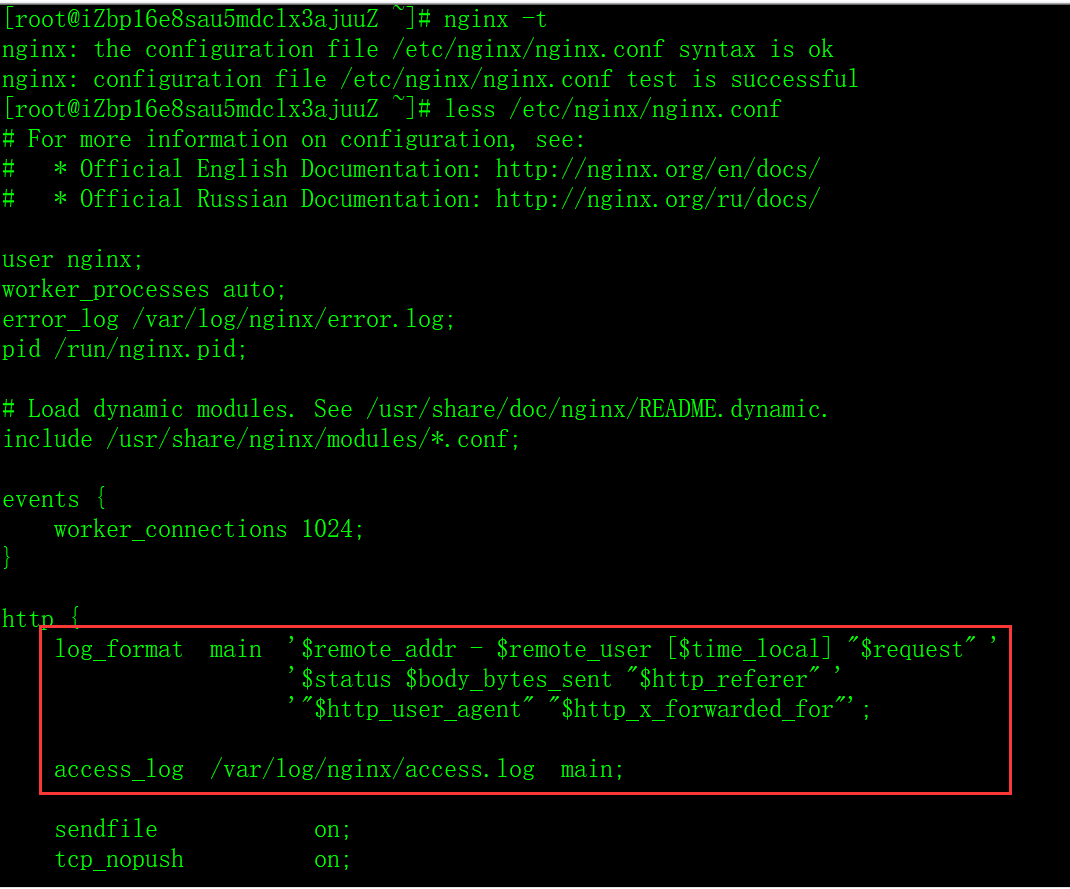
# 查看日志配置,不知道配置路径的话,可以执行 nginx -t
less /etc/nginx/nginx.conf
# 查看日志
cd /var/log/nginx;
ll
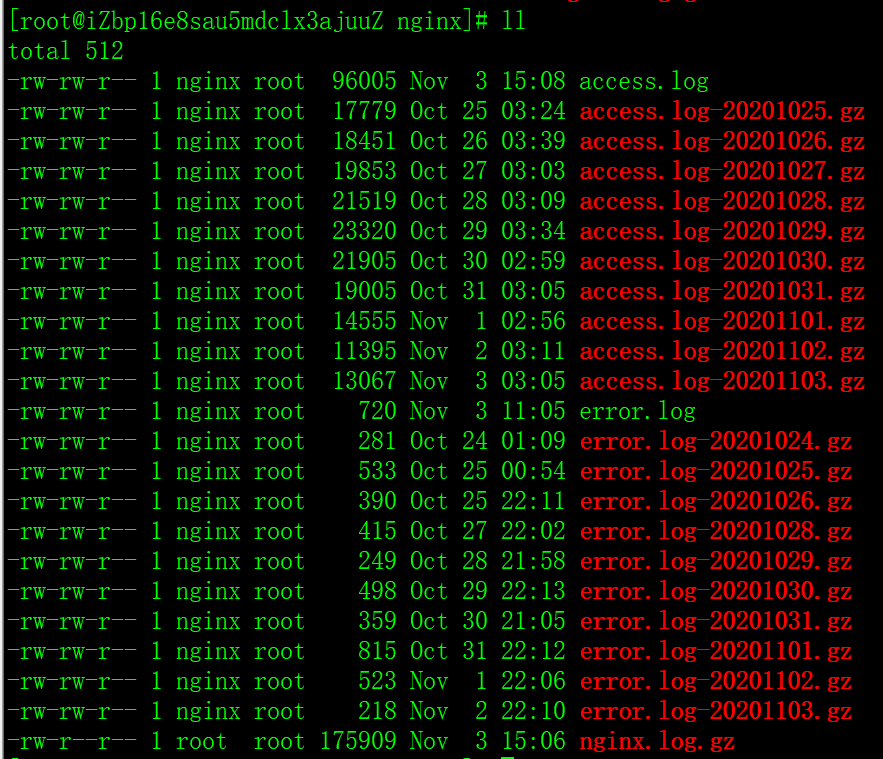
正常使用的话,这边应该使用 flume 直接将日志文件收集,并上传到 hdfs。方便起见,这边直接手动打包,上传。
# 合并打包日志
cat access.log > nginx.log;
gunzip -c access.log*gz > nginx.log;
gzip nginx.log;
sz nginx.log.gz;
2.原始记录加载到ODS层
# 上传解压日志
rz;
gunzip nginx.log.gz;
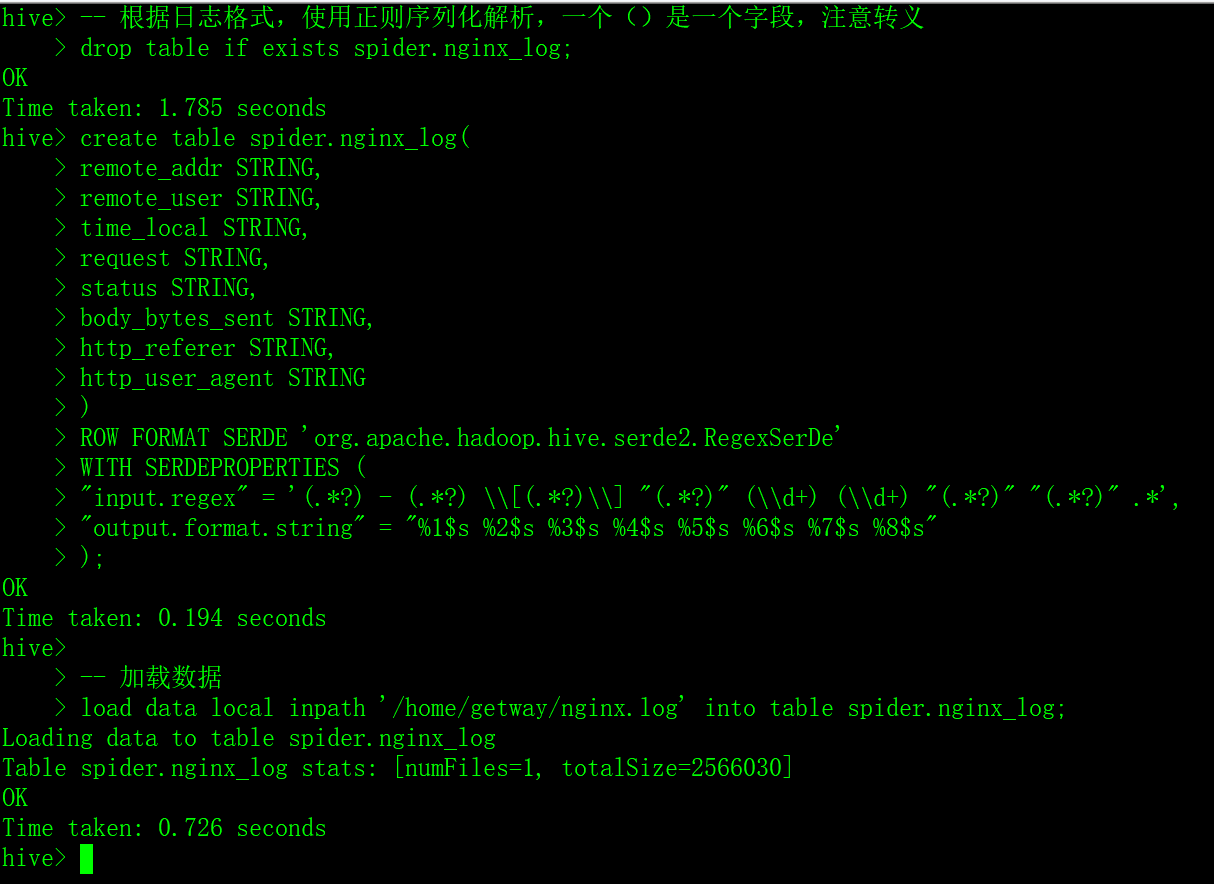
-- 根据日志格式,使用正则序列化解析,一个()是一个字段,注意转义
drop table if exists spider.nginx_log;
create table spider.nginx_log(
remote_addr STRING,
remote_user STRING,
time_local STRING,
request STRING,
status STRING,
body_bytes_sent STRING,
http_referer STRING,
http_user_agent STRING
)
ROW FORMAT SERDE 'org.apache.hadoop.hive.serde2.RegexSerDe'
WITH SERDEPROPERTIES (
"input.regex" = '(.*?) - (.*?) \\[(.*?)\\] "(.*?)" (\\d+) (\\d+) "(.*?)" "(.*?)" .*',
"output.format.string" = "%1$s %2$s %3$s %4$s %5$s %6$s %7$s %8$s"
);

-- 加载数据
load data local inpath '/home/getway/nginx.log' into table spider.nginx_log;
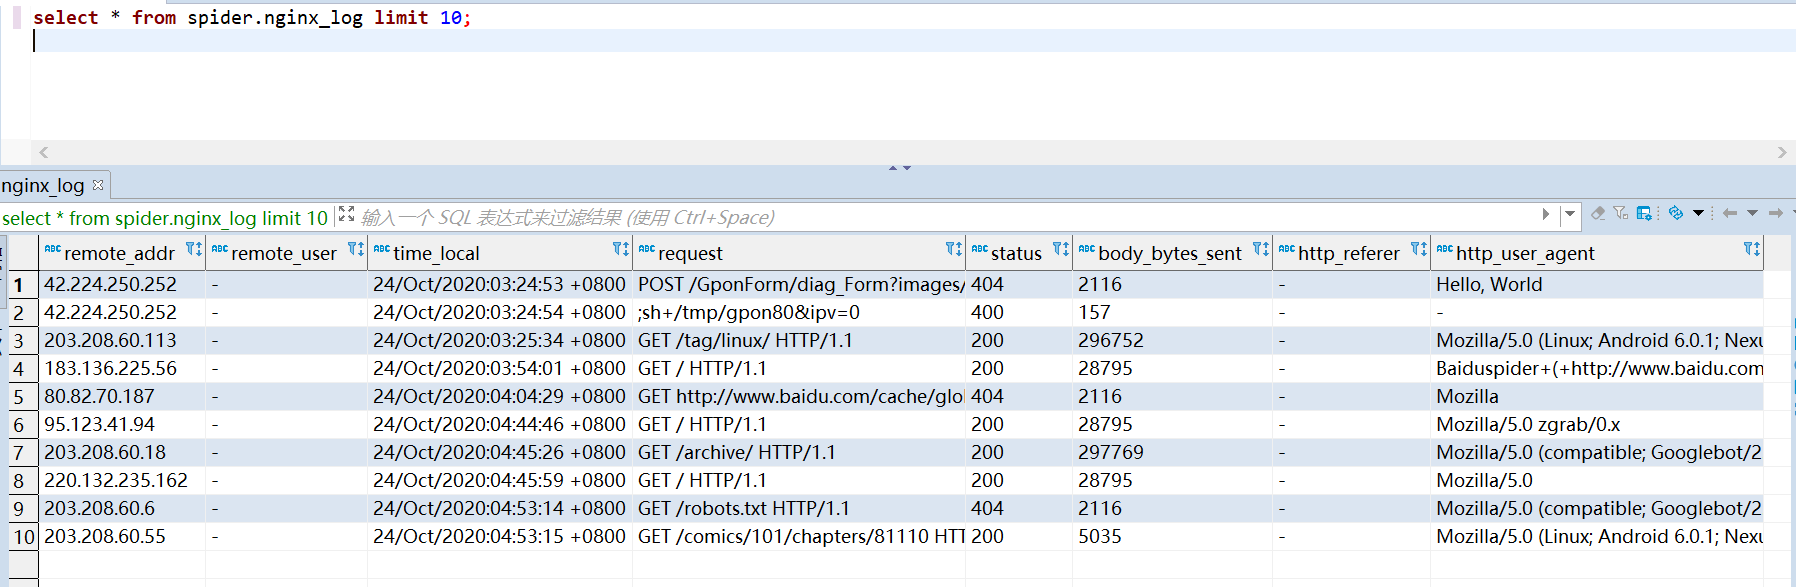
-- 查看一下原始记录
select * from spider.nginx_log limit 10;
3.数据清洗加工到DWS层
3.1 加工 IP 省份纬度表
-- 通过 udf 获取 ip 所在省份,创建IP和省份的映射表
set hive.exec.mode.local.auto=true;
set hive.exec.mode.local.auto.inputbytes.max=52428800;
set hive.exec.mode.local.auto.input.files.max=10;

add file /home/getway/udf_baidu_api.py;

create table spider.dim_ip as
select transform(remote_addr)
  USING 'python3 udf_baidu_api.py' AS (remote_addr, province)
from (
select remote_addr
from spider.nginx_log
group by remote_addr
) as cte;
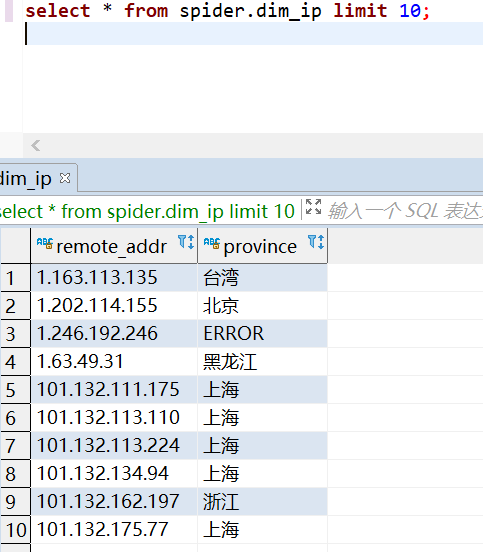
-- 查看一下加工好的数据
select * from spider.dim_ip limit 10;
3.2 加工 nginx 日志事实表
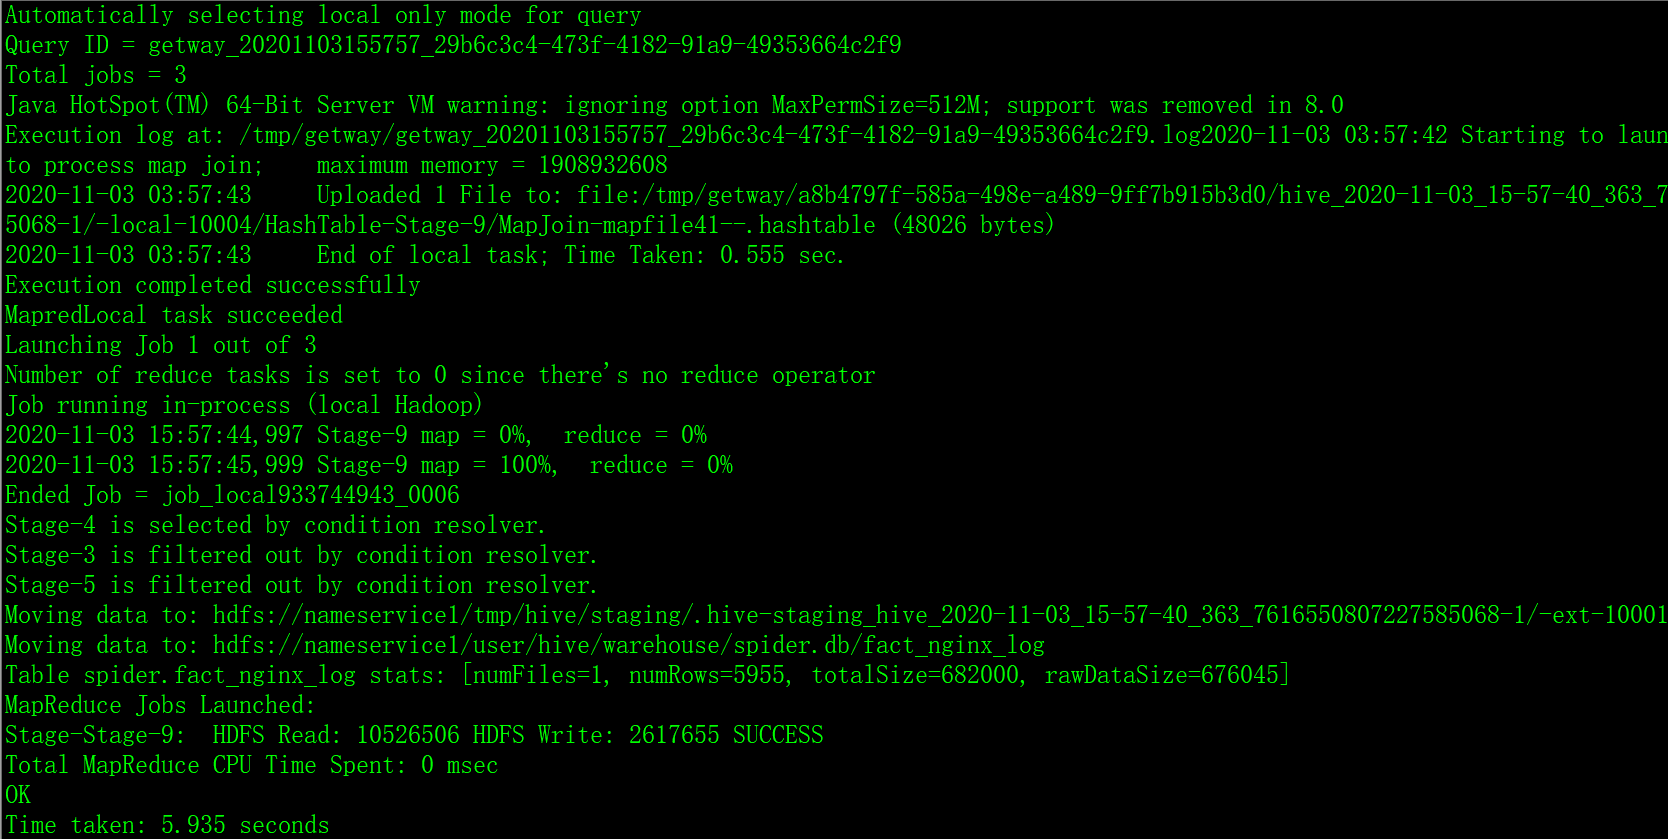
-- 数据清洗: 选择有用的字段,并通过 udf 解析 useragent,将数据写到新表 fact_nginx_log
set hive.exec.mode.local.auto=true;
set hive.exec.mode.local.auto.inputbytes.max=52428800;
set hive.exec.mode.local.auto.input.files.max=10;

add file /home/getway/udf_log_clean.py;

create table spider.fact_nginx_log as
select transform(a.remote_addr,
                 a.time_local,
                 b.province,
                 a.request,
                 a.http_user_agent
                 )
       USING 'python3 udf_log_clean.py' AS (remote_addr,
                                       time_local,
                                       province,
                                       request,
                                       device,
                                       os,
                                       browser)
from spider.nginx_log a
left join spider.dim_ip b on a.remote_addr = b.remote_addr
where a.request not rlike '\\.[css|js|woff|TTF|png|jpg|ico]';
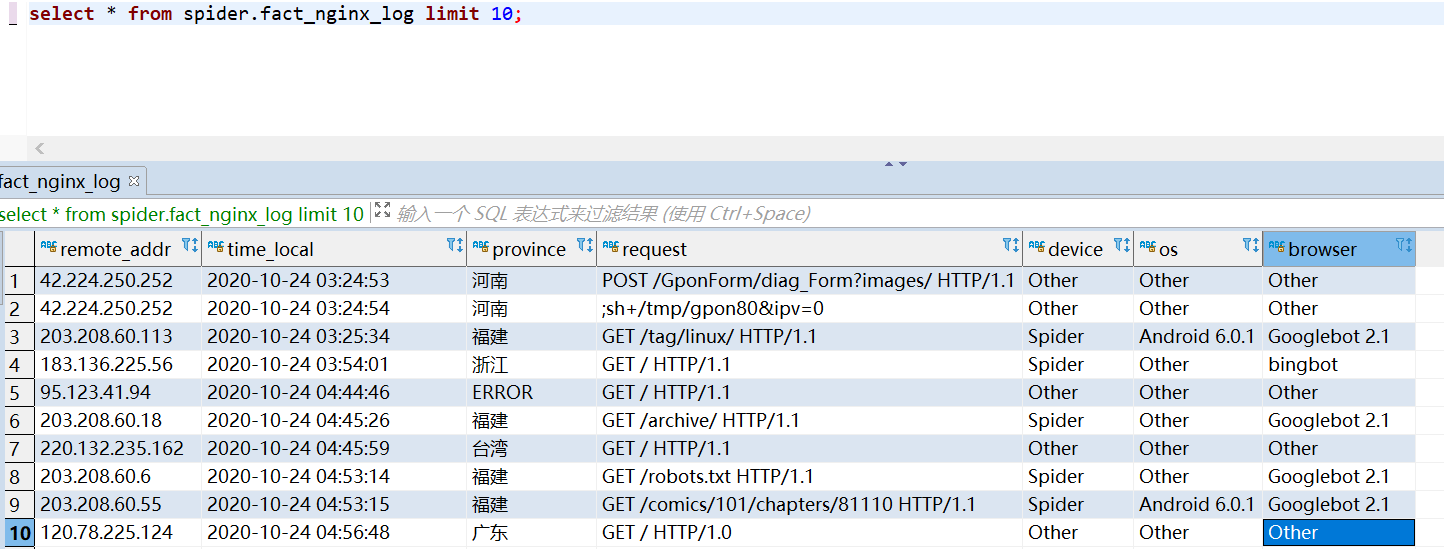
-- 查看数据示例
select * from spider.fact_nginx_log limit 10;
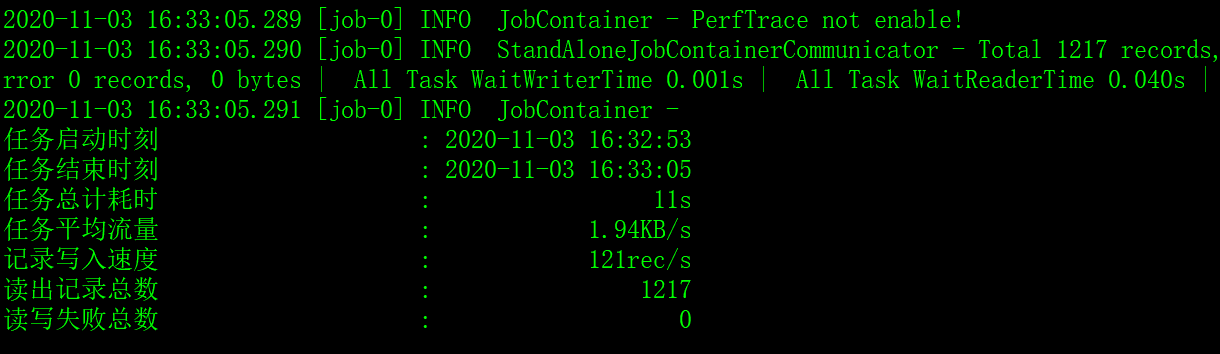
3.3 数据同步到 mysql
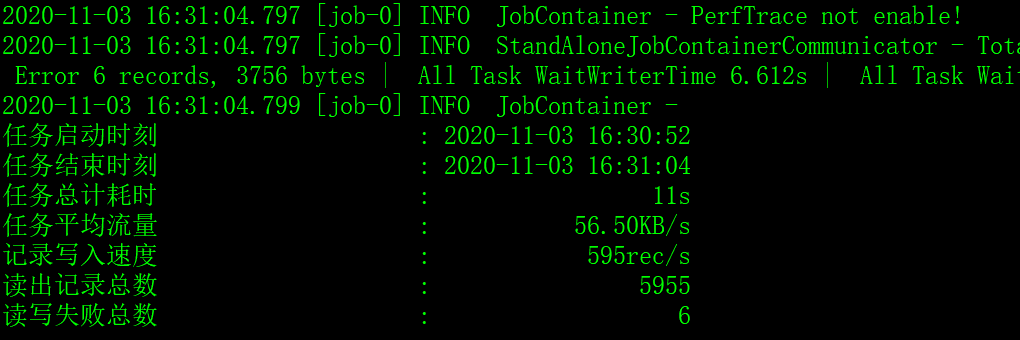
将加工好的表 dim_ip 和 fact_nginx_log,通过 DataX 同步到 mysql。
python datax/bin/datax.py fact_nginx_log.json
python datax/bin/datax.py dim_ip.json
4.数据分析可视化
数据都准备好了,分析就很简单,直接通过 sql 就可以查出想要的数据了。
数据量比较大时,加上适当的索引可以提高查询效率。
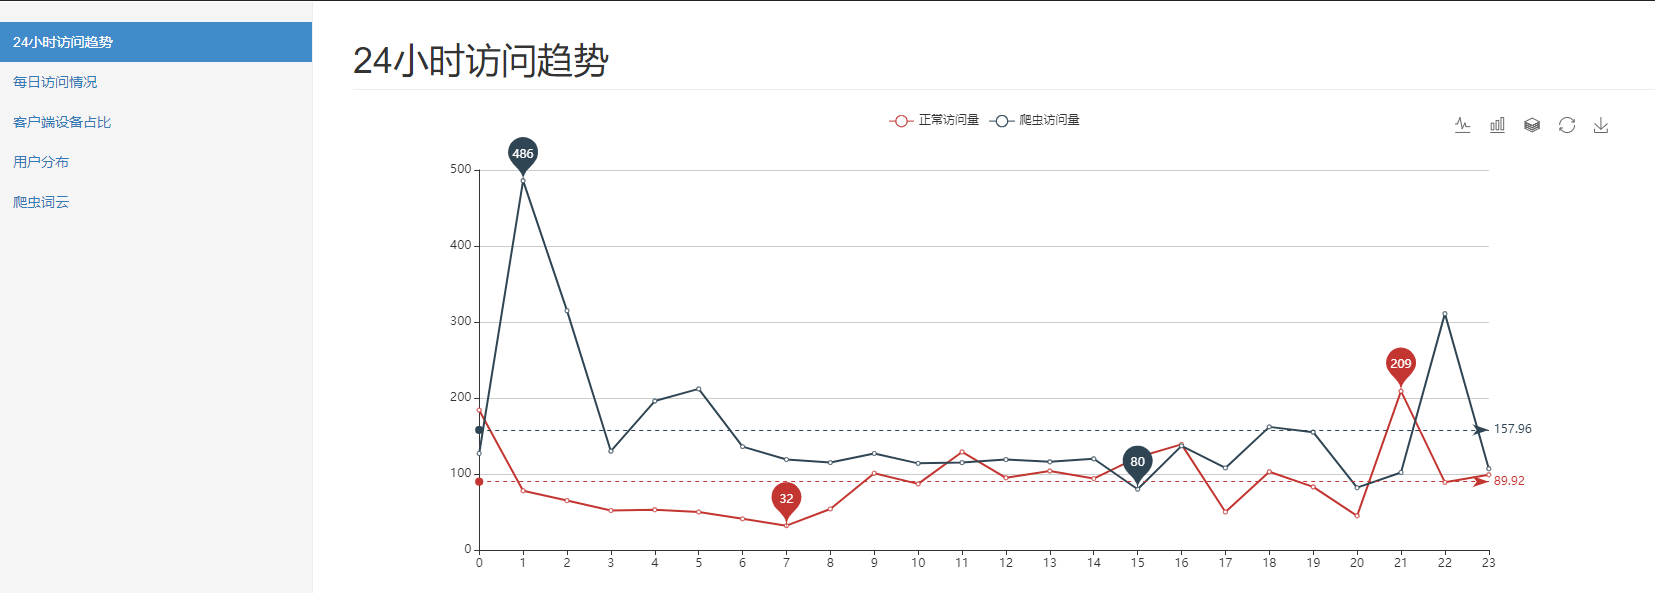
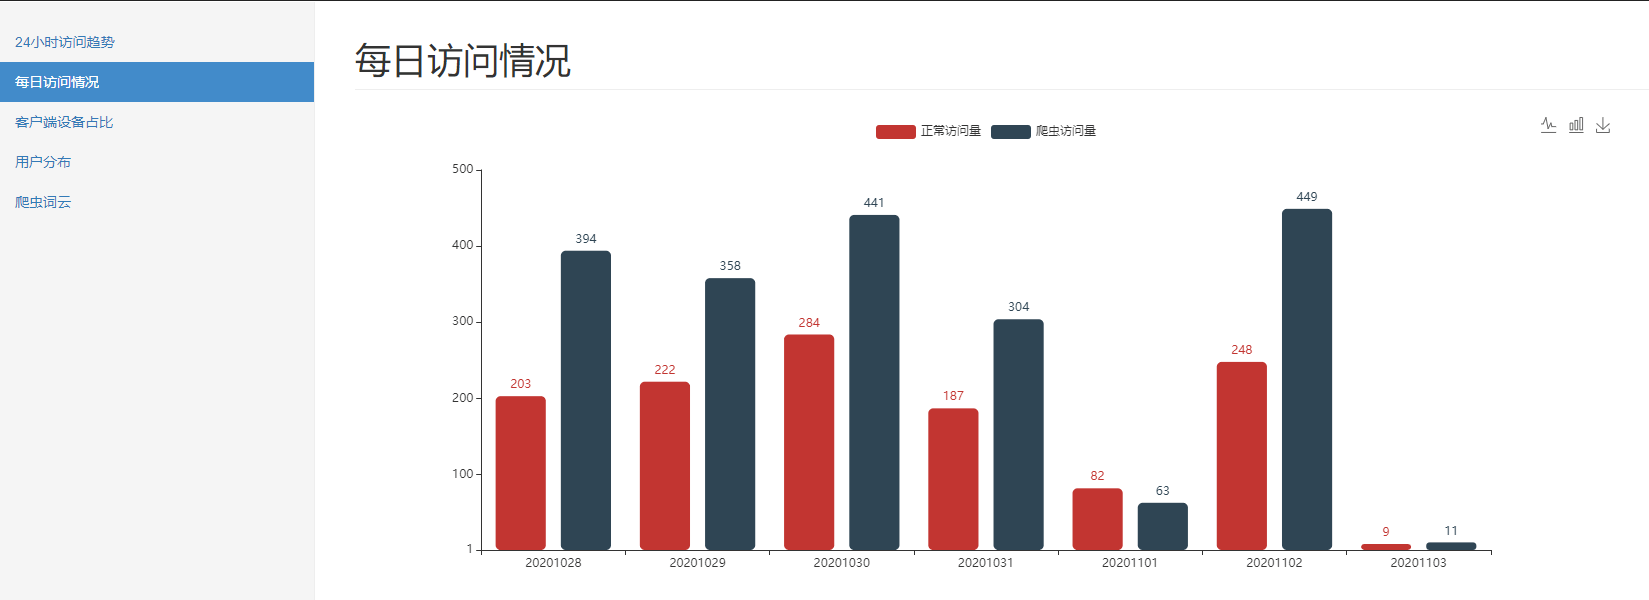
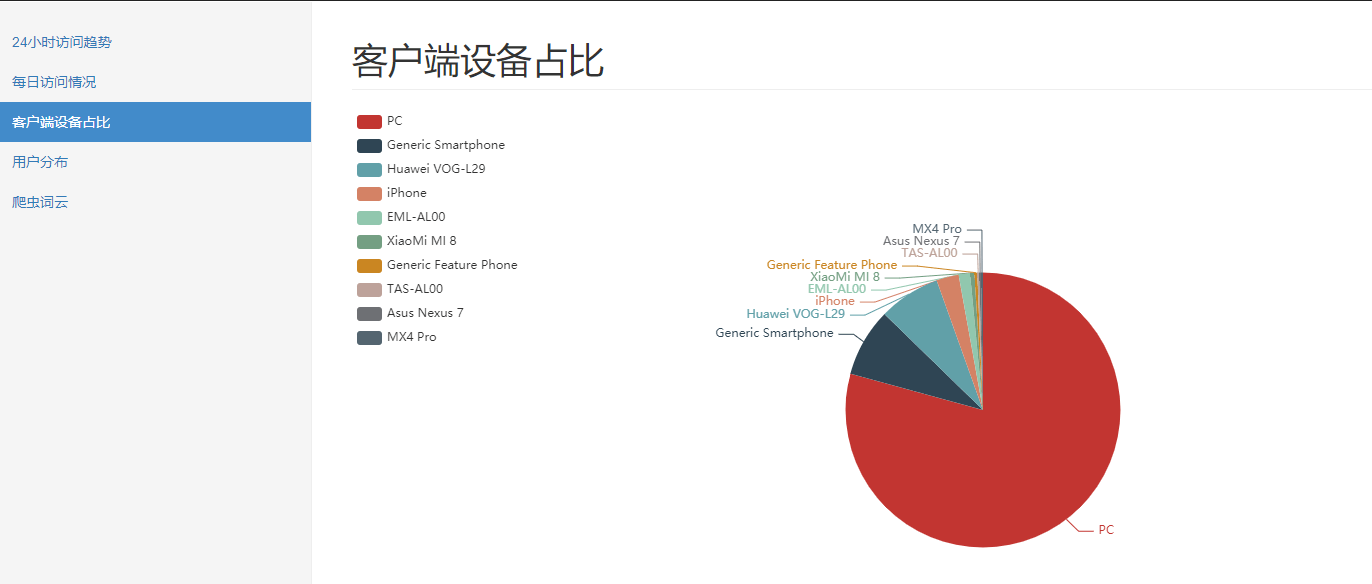
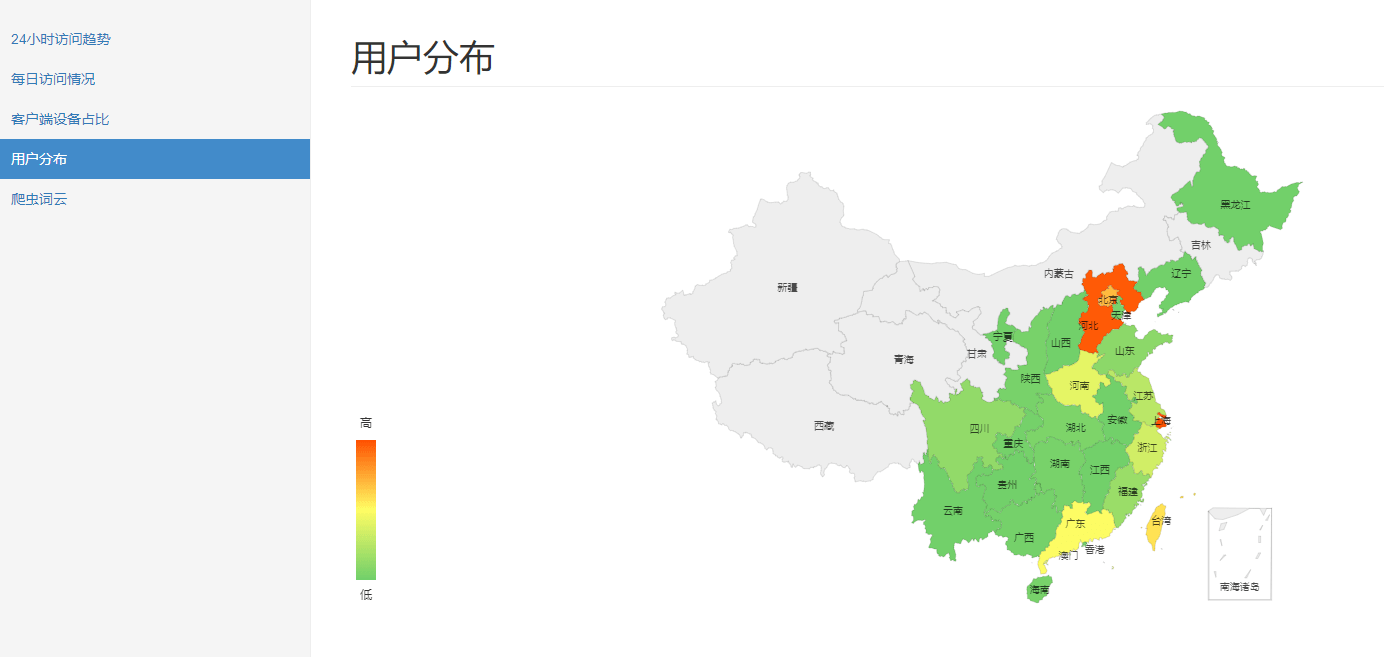
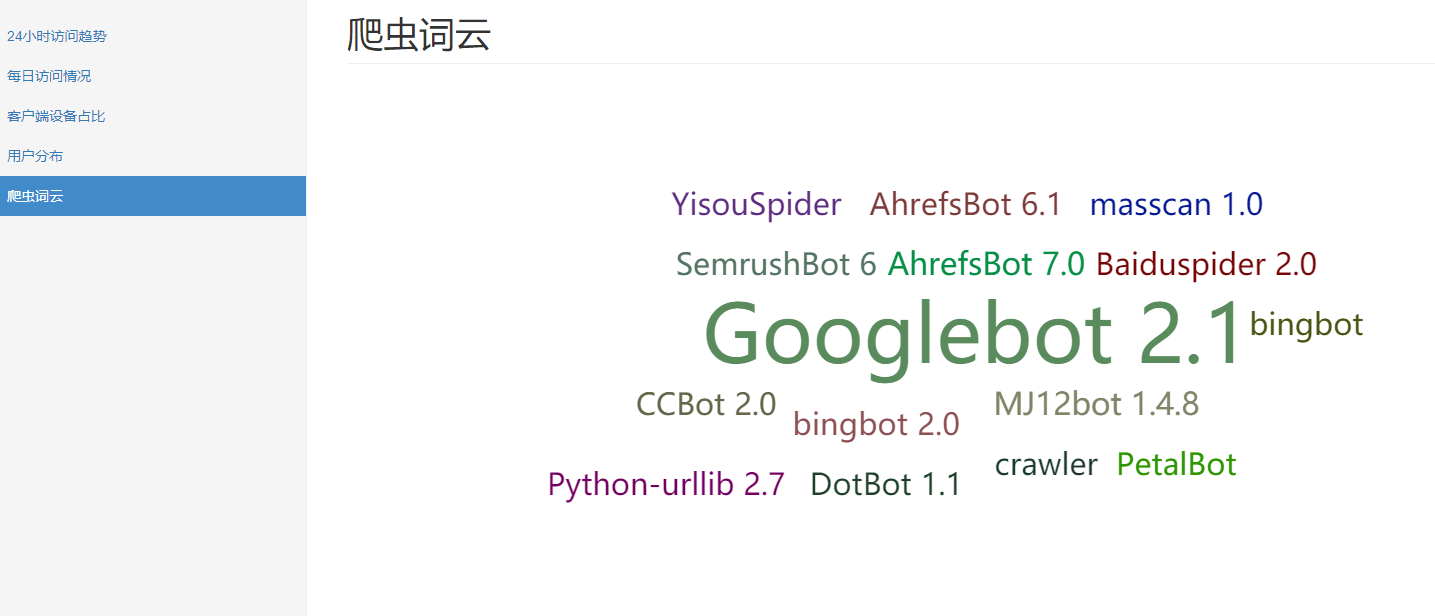
-- 用户分布
select province, count(distinct remote_addr) from fact_nginx_log group by province;

-- 不同时段访问情况
select case when device='Spider' then 'Spider' else 'Normal' end, hour(time_local), count(1)
from fact_nginx_log
group by case when device='Spider' then 'Spider' else 'Normal' end, hour(time_local);

-- 最近7天访问情况
select case when device='Spider' then 'Spider' else 'Normal' end, DATE_FORMAT(time_local, '%Y%m%d'), count(1)
from fact_nginx_log
where time_local > date_add(CURRENT_DATE, interval - 7 day)
group by case when device='Spider' then 'Spider' else 'Normal' end, DATE_FORMAT(time_local, '%Y%m%d');

-- 用户端前10的设备
select device, count(1)
from fact_nginx_log
where device not in ('Other', 'Spider') -- 过滤掉干扰数据
group by device
order by 2 desc
limit 10

-- 搜索引擎爬虫情况
select browser, count(1) from fact_nginx_log where device = 'Spider' group by browser;
最后,通过 pandas 读取 mysql,经 ironman 进行可视化展示。
基于 flask 和 echarts 的数据可视化工具 ironman
5.总结和思考
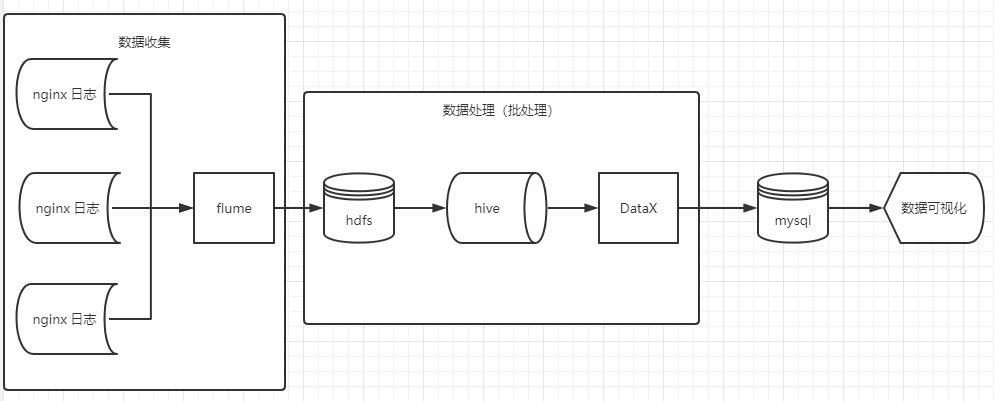
整体来看,这个批处理过程的优势有以下几点:
- 存储:原始记录集中收集到了 hdfs 集群,变成了分布式存储,自动冗余容错
- 处理:使用 hive 进行分布式处理,理论上数据多大都不怕,真正实现大数据处理
缺点则在于:
- 实时性:由于是离线的批处理,所以实时性比较低,一般部署为 T+1
可能的瓶颈和优化方向:
-
瓶颈:加工好的事实表直接落在了 mysql,报表的分析计算也都是在 mysql 完成的,随着数据的增长,mysql 的性能上限会变成瓶颈,导致报表查询越来越慢。
-
优化方向:临时处理,可以在 mysql 表上加上合适的索引,甚至还可以通过分库分表等方式进行数据库的设计优化;一劳永逸的办法,应该是把 事实表的存储和分析计算都迁移到 hive,只将最终计算好的报表数据,存到 redis,然后报表查询时直接读 redis。
6.开源地址
https://github.com/TurboWay/bigdata_practice
版权声明:如无特殊说明,文章均为本站原创,转载请注明出处
本文链接:http://blog.turboway.top/article/bigdata_practice_batch/
许可协议:署名-非商业性使用 4.0 国际许可协议